Increasing user activation: how we set up Clew’s own onboarding with Clew
A hover hint on the sign-up form, a first-session tour, a popup with an A/B test of its colors, and a “run your first A/B test” checklist. Why each one is there, how it is configured, how much traffic the test needs — and why there are no results yet.

Posts about activation usually hand you a list of tips. We would rather show what we do ourselves: the onboarding new Clew users see, how it is configured and why. There are no result numbers here — the data is still coming in, and we won’t pass off the first few days as a conclusion.
What we count as activation
For Clew it is publishing a first tour. Someone who signed up but published nothing never saw the product work on their own site.
On the way there are two places where installs die most often: copying the widget snippet, and waiting for the widget to send its first events from the customer’s site. The four pieces below each target a different stretch of that path.
1. A hint on the sign-up form
It appears when the pointer rests on the email field of the sign-up page, and only for people who aren’t signed in.
We chose hover over showing it automatically: the form is short and most people don’t need an explanation. The hint is for whoever lingers on the field and hesitates.
2. A first-session tour
A tour on the dashboard’s overview page. Its job is to get people to install the snippet and publish a first tour without walking them through every menu on the way. The settings:
Where:      URL prefix /admin/overview
Who (all):  signedUpDaysAgo   less than  1
            hasPublishedTour  equals     false
Frequency:  once
The dashboard passes properties such as signedUpDaysAgo and hasPublishedTour to the widget through identify(). They are coarse facts only — plan, role, days since sign-up, whether a tour is published or an A/B test is running, interface language. No email, no user IDs.
3. A popup after 5 seconds — and an A/B test of its colors
On the site’s pages a modal appears five seconds after load. It has two color themes, and that is the A/B test: half the visitors get theme A, half get theme B. The copy is identical; only the colors differ, because Clew can test a theme separately from the content.
The variant comes from a hash of the visitor’s random ID and the tour name, so someone who returns tomorrow sees the same one. We checked the hash on random and on sequential IDs, and the split came out at 49–50%.
How many visitors it takes to see a difference
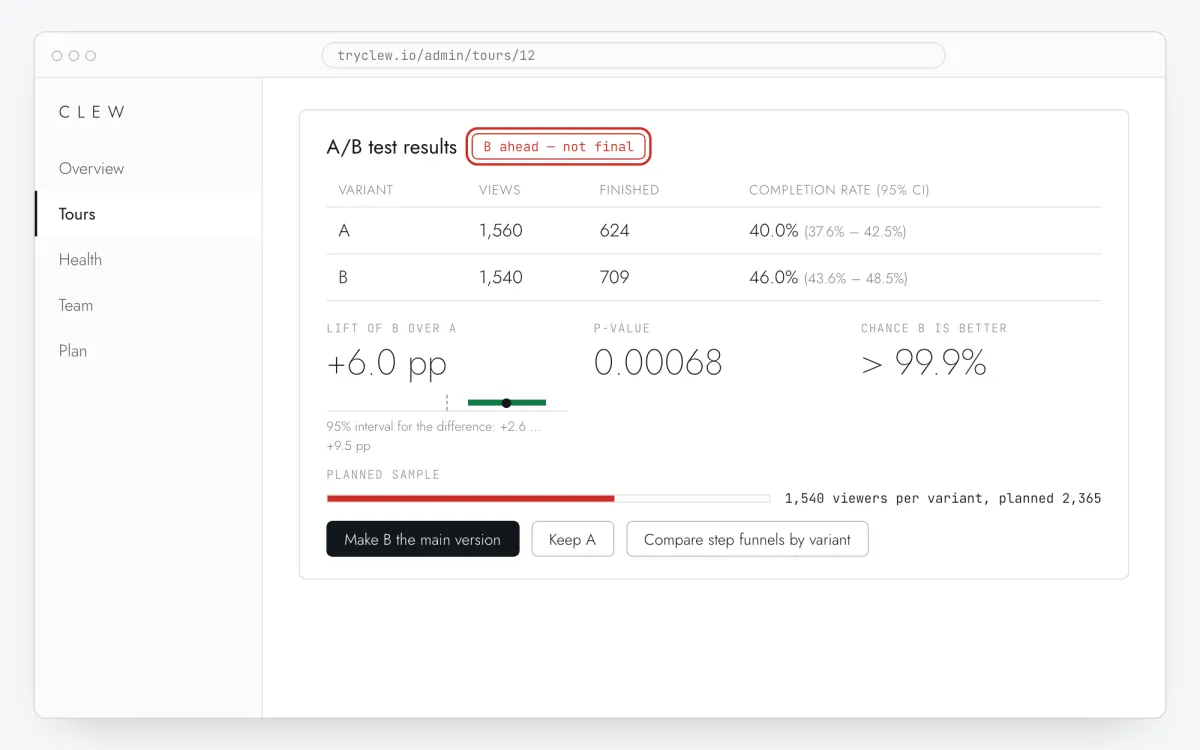
The Clew dashboard plans the sample with the same formula as our A/B test calculator (Evan Miller’s): 5% significance, 80% power, and by default it looks for a 10% relative lift. Variant A’s conversion rate serves as the baseline.
Here is what the formula gives, in visitors per variant:
- 10% baseline, detecting a lift to 11% (+10%) — 14,313;
- 10% baseline, detecting a lift to 12% (+20%) — 3,623;
- 20% baseline, detecting a lift to 22% (+10%) — 6,348;
- 40% baseline, detecting a lift to 44% (+10%) — 2,365.
A color change rarely moves anything by 20%. On a small site’s traffic a test like this can run for months, and calling a winner after three days means crowning noise.
The dashboard guards against that. If the difference turns significant before the planned sample is reached, the result is marked as early. If the test has run for a week or more and, at the current pace, won’t reach its sample within 90 days of starting, the verdict is “not enough traffic”. It also checks whether the actual A/B split matches the configured one (a sample ratio mismatch test); if it doesn’t, the results can’t be trusted, and the dashboard says so.
4. The “Run your first A/B test” checklist
The dashboard shows a five-item checklist. None of the items is ticked by clicking — each one ticks itself when the event has actually happened:
snippet_copied— the install snippet was copied;widget_live— the widget sent events from the site, the install is live;tour_published— a tour was published;ab_started— a tour’s A/B test was switched on;ab_decided— the test was ended: B promoted or A kept.
The dashboard calls Clew.complete('key') at the same points where it sends the matching analytics events. If an event fires while no checklist is on screen — between two dashboard screens, say — the key is held and ticks the item as soon as the checklist appears.
Why A/B testing and not “create a tour”: the first-session tour already leads to the first tour. The checklist pulls further, toward a feature that exists only on paid plans and that is easy never to reach without a nudge.
What we can and can’t measure
- Stats for our own tours are collected only on public pages, and only for visitors who accepted analytics cookies. Tours inside the dashboard are shown but not counted — that is what our privacy policy promises.
- So the first-session tour and the checklist are judged not by tour stats but by the sign-up → install → first published tour funnel, from server-side data.
- The popup’s A/B test is counted in Clew itself, but only among visitors who consented. That skews the sample: not everyone consents, and those who do may behave differently.
Results
What carries over to your product
- Name the one action you count as activation and find the points on the way where people drop. Put onboarding there, not on the first screen just in case.
- An identify() call is one line of code. Without it you can’t tell a newcomer from someone who has already done everything.
- Checklist items that tick on an event are more honest than manual ones: nobody can tick what they haven’t done.
- Work out the sample size before you start a test. If your traffic needs half a year to reach it, test a bigger change.